
")

„Non-refundable financial support granted by the European Union and the Hungarian State for „electricity supply, operating under extreme operating conditions (dripping water, underwater operation, etc.), measuring and transmitting a mass flow minimum, and reducing water loss in drinking water networks” The project is funded by a grant of HUF 76.18 million in the framework of project GINOP-2.1.7-15-2016-00268; The development is carried out from the tender submitted under the call for proposals GINOP-2.1.7-15-2016 "Prototype, Product, Technology and Service Development", PROCOMP Computer and Electronics Ltd.
History
PROCOMP Computer and Electronics Limited Liability Company Registered under GINOP-2.1.7-15-2016-00268 has won a grant of HUF 46.96 million for its project name of electricity supply, operating under extreme operating conditions (dripping water, underwater operation, etc.), measuring and transmitting a mass flow minimum and transmitting electronic water quantity to reduce water loss in drinking water networks
Water service today,market analysis
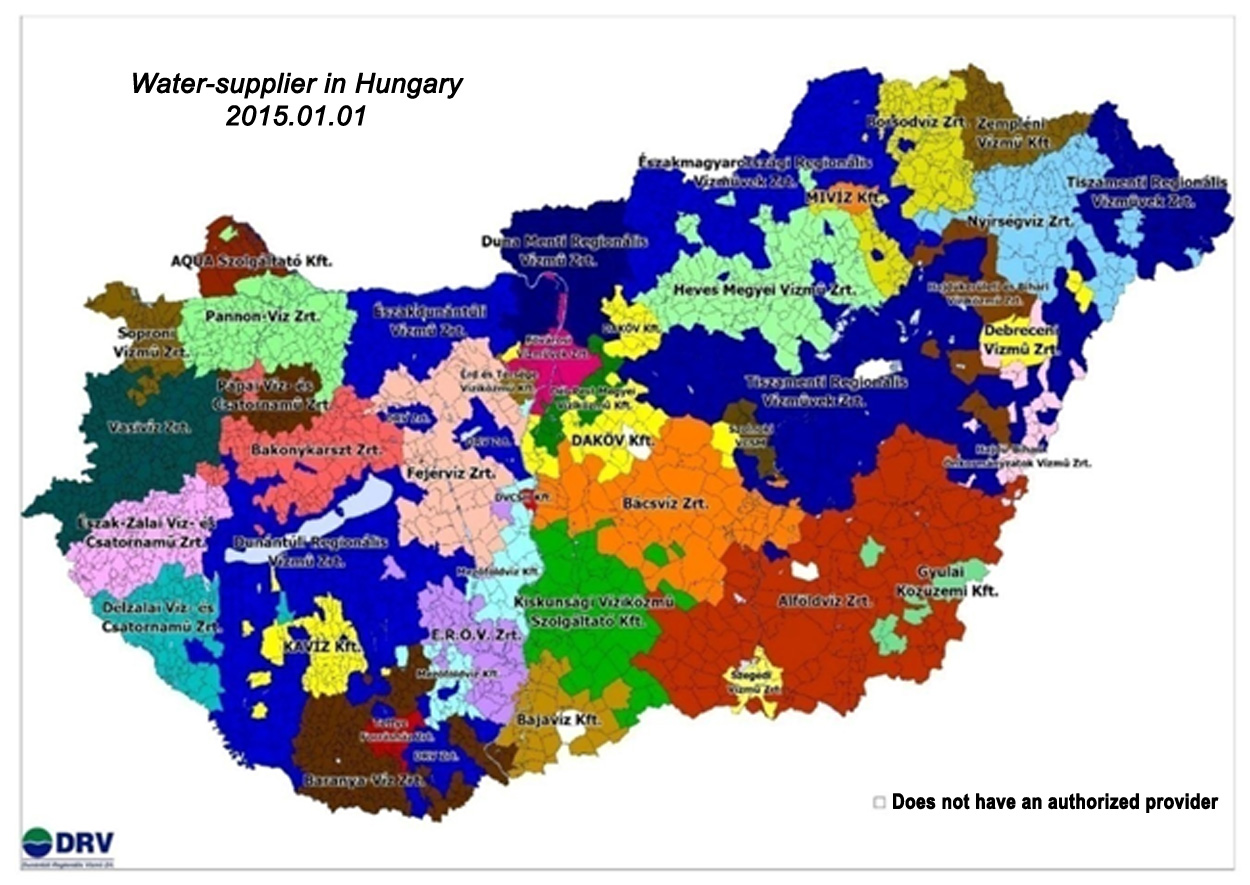
Nowadays the value of drinking water has increased significantly. This is not only because of the rising cost of extraction, but also because, in today's world, high-quality drinking water has become shortage in the world. Drinking water is provided by water utilities to consumers. With the streamlining of water utilities, there are currently 41 major providers in Hungary. (Annex 1 on 41 Providers)
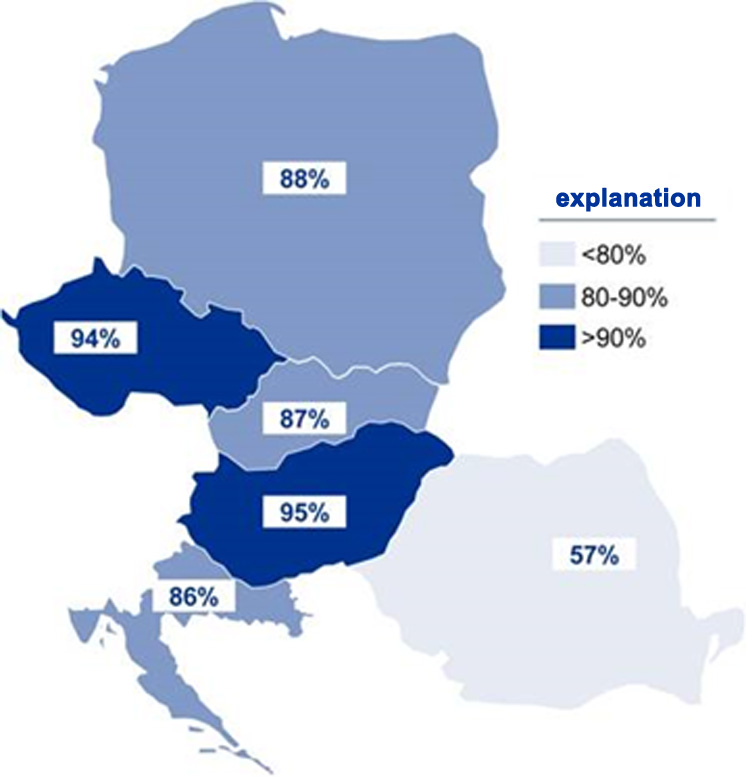
In Hungary, tap water was connected to all Hungarian settlements, and 95% of households have access to the network. This is the best rate in Central Europe.
Three quarters of the annual water consumption of about 440 million cubic meters is connected to residential use a year. The average daily water consumption per person is 90-100 liters. With the decline in industrial production, non-household drinking water consumption fell significantly, leading to an increase in the share of residential consumption from 64% to 76% of total consumption.
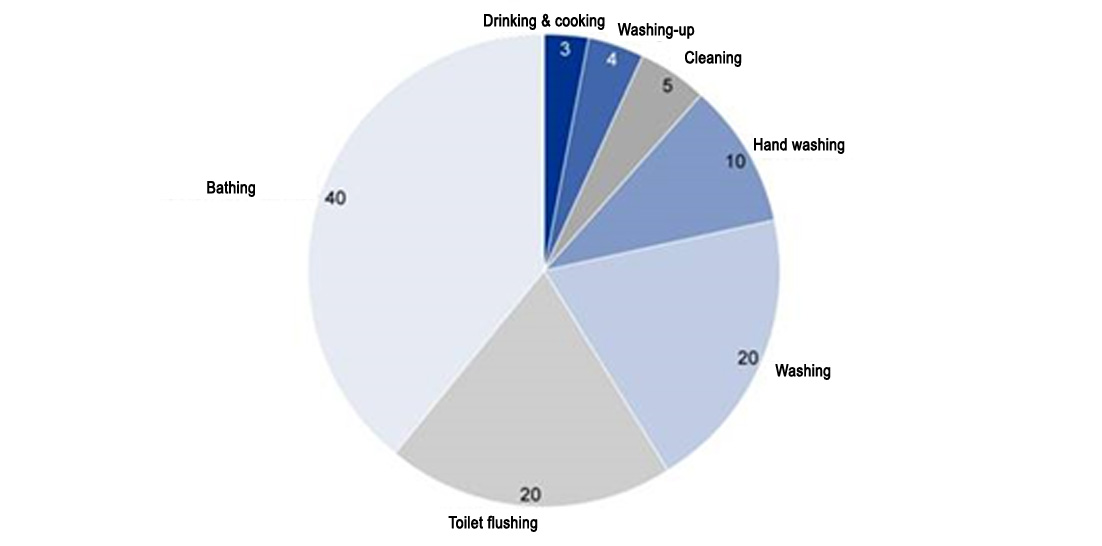
Tap water used for drinking and cooking accounts for only a few percent of the approximately 100 liters of water per day. The largest proportion, about 40%, is used for showering and bathing, one-fifth for toilet flushing, another one-fifth for washing and one-tenth for hand washing.
Schematic supply chain for water utility supply
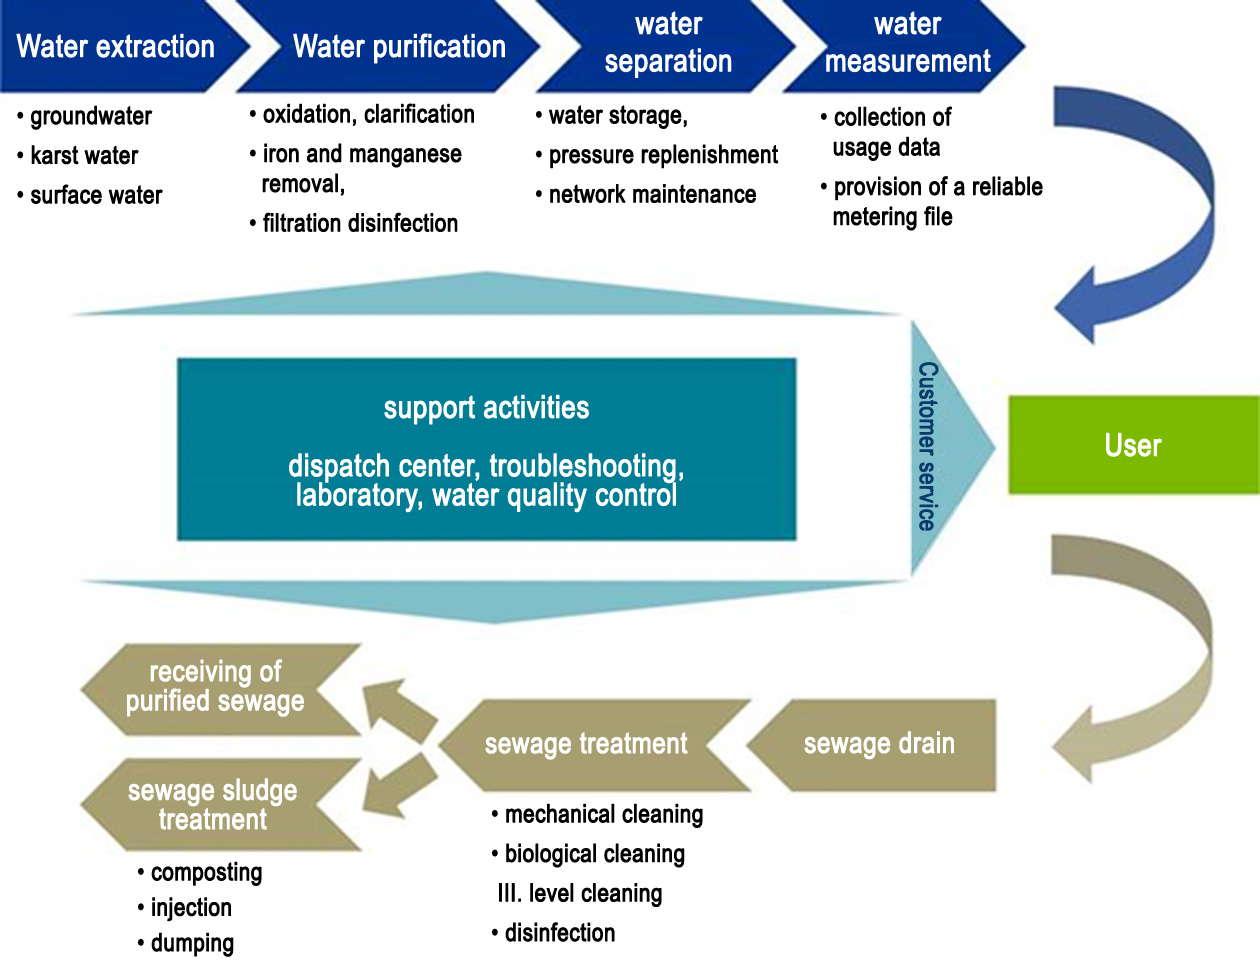
The supply chain presented is linked to the core business processes of the statutory water utility service.
The distribution of purified water is divided into well-defined areas. This is done by branching underground water from the main branch in wells equipped with water meters. This ensures that a water supply area can be closed separately in the event of a pipe break or other malfunction.
The water consumption of a given branch or area is the sum of the amount of drinking water consumed by consumers and the losses of the network. The loss of the drinking water network is therefore the difference between the amount of water fed into the area and the amount of water sold. The loss of the drinking water network is therefore the difference between the amount of water fed into the area and the amount of water sold.
Hungary's drinking water production and consumption (million cubic meters)
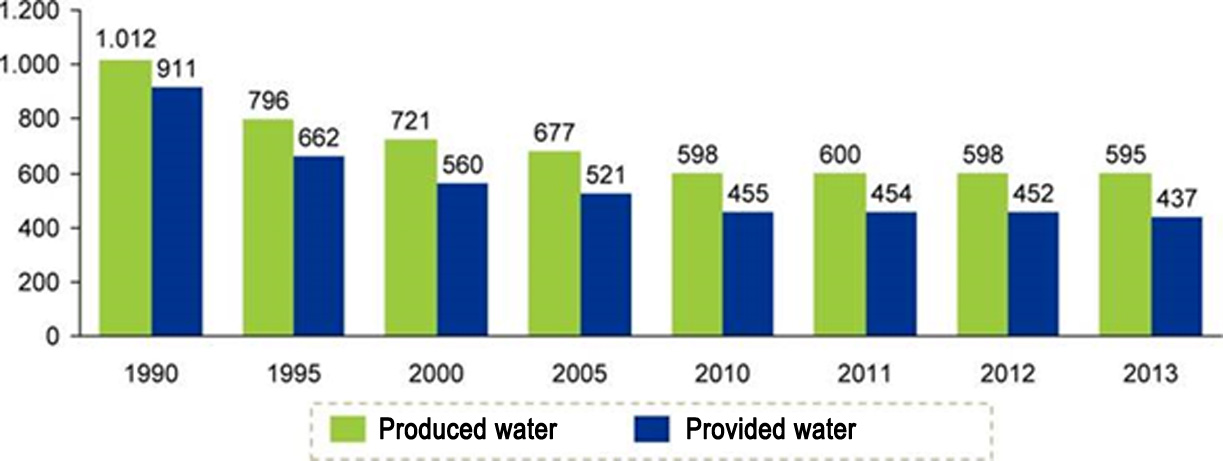
The difference between the amount of water produced (fed to the system) and delivered (delivered to consumers), ie the difference in sales, is due to technological (for washing) water use, on the other hand, the result of water loss. Some of the water loss is due to unlicensed reception, and most of it occurs in the form of pipe breakage, measurement loss, leakage, or network loss.
Leakage or breakage in the pipeline is the dominant part of the loss. According to MAVÍZ's statistics covering almost 100% of the water utility service in Hungary in 2009: • the population receiving water supply: 8.902 million people • the total population of the area served: 9.457 million people • the length of the water network: 58 330 km • produced drinking water: 553 272 m3 / day, • sold drinking water: 441 720 m3 / day, • unsold drinking water (NRW): 111.552 million m3 / year. More than 20% of the drinking water supplied to the grid (20.16% of the water produced, 25.25% of the water sold), ie 111.55 million m3 per year is lost on the road. It is worth HUF 33,465 billion, calculated on an average water price of 300 HUF / m3 per year. For Zalavíz Zrt .: annual water production is 5.110.000 m3, according to the above data, the annual water loss is 1.022.000 m2. At a price of 300 HUF / m3 this is 306,600,000 HUF.Clever measurement
The introduction of smart metering in the water utility sector has many benefits for operators and users alike. For example, the technology can be applied in the following areas: remote reading, prepayment of consumption, limitation of service, verification of measuring authenticity,localization of fractures and plugs. Prompt, on-line delivery of metering data to the customer relationship and billing system, on-line user information, fast, cost-effective application of various consumption restrictions, and use of prepaid metering would all be beneficial features.
figure: Schematic presentation of smart metering
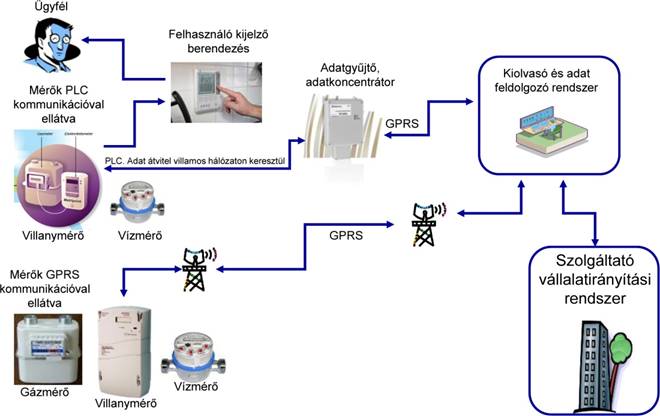
However, in order to reap the benefits, significant challenges need to be addressed:Electronic meters do not measure in the event of a power failure, but battery meters have a shorter life span and are more vulnerable. Communication between the water meter and the data concentrator (data acquisition unit) may be difficult due to the distance and power consumption. Providing the necessary energy supply can be challenging..
Nowadays, the so-called water supply system is the most common implemented data transfer solution for smart metering is the "webSCADA process control system". WebSCADA provides the ability to collect and distribute Supervisory Control And Data Acquisition (SCADA) information. It queries directly its associated technology units (eg boilers, water towers, reservoirs, pumping stations) and communicates via a PBX. Communication can be via UHF, cable and GPRS. Apparently, webSCADA was developed primarily for process control. Because of its network power supply needs, it is unsuitable for processing and transmitting data with mechanical metering water meters in underground manholes, and is unusable in extreme operating conditions. Remote sensors with no electricity, operating under extreme operating conditions (dripping water, underwater operation, etc.) are virtually unsolved. This is what our development provides.
Technical and professional content of the project
The construction of electronic monitoring systems is generally greatly hampered by the lack of power supply to underground measuring shafts, which in many cases is difficult or impracticable given the location of the measuring shafts away from the power grid. The situation is further complicated by the fact that the meters often operate under extreme operating conditions (dripping water, underwater operation, etc.). If daily consumption data were recorded on area meters (with particular reference to the minimum mass flow rate), their daily processing and evaluation would be a good indicator of the area's loss parameter. For example, an increase in the area's 24-hour so-called mass flow minimum would make the pipe break likely, but area meters would also be able to observe changes in the amount of water below the unit of population's rhythm. The districts are characterized by minimum and maximum water consumption values in addition to the 24-hour daily cycles. The aim of the project is to develop an electronic data acquisition and mass flow minimum detection system that facilitates the remote monitoring of drinking water networks by utilizing the data measured by pulse flow meters with mechanical operation on the drinking water networks and by transmitting them remotely over the GSM network. With the implementation of the project, network diagnostics specialists of drinking water supply companies can make decisions based on measurement results on the areas of fault detection, so measures that significantly reduce the amount of water loss can be implemented on time. The development includes a low power mass flow meter and transmitter that can be installed in the manholes for mechanical water volume meters and works in extreme operating conditions, and operates for 6-8 years without battery replacement. It constantly collects all the data amount of water flowing. It records the hourly water consumption and the minimum mass flow rate (the longest time between two successive quantitative pulses in a given hour). The minimum mass-flow value is the characteristic of a given area that best indicates the water loss status of the network. It compiles a daily consumption data set from the recorded consumption data, summarizing the water flow through the meter for the last 30 hours, the minimum value for the mass flow, and the water meter number and cumulative water consumption after installation. The data packet, which is composed of the water volume measurement data thus obtained, is transmitted, via wireless data transmission, to a GSM communication device installed in its vicinity. To evaluate the data coming from the GSM network to the developer's WEB interface and specific to the drinking water areas, a program that takes into account the requirements of the water supplier is prepared. The program processes the incoming data immediately upon arrival and makes it available to the water supply dispatcher (client) on the Internet. The mass flow minimum meters, according to the service provider's requirements, are not only in the industrial manholes, but also in the public can also be placed in a residential manhole. It can also be great for detecting illegal water seizures.
What is new?
The system is based on the latest electronic and IT technologies. Compared to remote monitoring systems with similar technology but for other applications, a minimum solution for mass flow measurement and taking it into account is a more accurate and valuable result.
1. Minimum mass flow measurement: The data logger calculates the pulses from different types of meters and determines the numbers per hour. In addition, the data logger also performs a minimum flow rate measurement within an hour by its pulse time measurement function. The measured minimum mass flow rate is a status characteristic of a drinking water network. Knowing this value allows network diagnostics professionals to delimit the probability of network water loss.
2.Other solution: Unlike other solutions, the GSM communication measurement transmitter is physically a separate unit. The wireless connection between the data logger and the communicator unit has the advantage that the communicator can be located in a place with GSM signal strength, which is a prerequisite for operation. If necessary, even off-shore equipment can be easily solved without wiring. Separated layout also has many advantages in terms of service operation. For example, in the event of a malfunction, the data acquisition function will continue to function smoothly, so there is no cumulative data loss.
3. Operable under extreme operating conditions:
It can work in a measuring shaft under extreme operating conditions. The electrical and mechanical construction of the data acquisition and GSM communication device is such that it can operate under extreme operating conditions (dripping water, underwater operation, etc.).
4. Long-term serviceability without battery replacement:Without battery replacement, lasts 6-8 years. A battery-powered, data logger and GSM communications low power device will be developed that will last 6-8 years without battery replacement. In addition to low-power electronics, this requires software and communications that can be powered by an affordable battery for 6-8 years.
5. Multipurpose use of GSM communicator: The GSM communicator acts as a "mailbox". Instantly transmits data packets to the developer's WEB server over the GSM network anytime, anywhere. Because of this feature, any data logger, alarm, etc., that is within range of the receiver. system data packet can be sent to the dispatcher on duty around the clock. For example, for monitoring of mine condition (manhole theft, manhole water saturation, etc.), but also for transmission of burglar alarm, fire protection, alarm.
6. Manual reading of the logger on site: In case of any communication or processing error (GSM service error, server error, WEB network error, etc.) it is possible to read the data stored in the data logger by means of a handheld device in the measuring shaft. This prevents data loss.
7. Evaluation software Software for evaluating incoming drinking water district data In order to evaluate the incoming drinking water district data (consumption and mass flow minimum values) from the GSM network to the developer server, a program that takes into account the requirements of the water supplier is prepared.
PRESENTATION OF ACTIVITIES
1. 6 pcs. selection of a different site (underground manhole) a. Groundwater reinforced concrete shaft measuring 1 settlement b. manhole on busy main road flooded depending on weather c. continuously groundwater / meter is under water / manhole d. Dry reinforced concrete shaft measuring 1 settlement e. Reinforced concrete shaft flooded with groundwater measuring 2 settlements f. reinforced concrete shaft for industrial consumer
2. 3 pcs. Creating a developer workplace • Developing a workstation for mass-current minimum and transmitter electronics • Developing a GSM communications device • Evaluator and information interface programmer
3. To develop water-efficient metering systems for extreme operating conditions, battery-powered, mass-flow minimum, and transmitter-free electronics that will last 6-8 years without battery replacement.
4. To develop a battery-operated GSM communication device for water measuring stations with extreme operating conditions for 6 to 8 years without battery replacement.
5. Starting the test run Part I, for data logger, GSM communicator and GSM network operation only: a. positioning of loggers in water volume manholes operating under different operating conditions; b. installation of GSM communicators near data collectors in a suitably chosen protected location; c. initiation and evaluation of tests.
6. Data collection, evaluation: WEB storage, server computer installation, evaluation program development
7. Graphic display system design: The display shows the status of the measurement points, statistics and graphs collected by the program, and clearly identifies the anomaly.
8. Product documentation
9. Test run II. Part I: Testing a Complete System
10. Evaluation of results with the assistance of an external expert
11. Developing the final product attributes based on peer review
13. Market Appearance Activities: a. Market research, market research (commissioning of studies); b. DEMO Asset Construction c. Preparation of marketing material d. Participation in exhibitions and presentations
RESULTS
Currently, because of the rare and non-simultaneous reading of meters, water providers do not receive data that would provide immediate and measurable results in detecting losses. The result of the project is the development of an electronic data acquisition and mass flow minimum detection system that facilitates remote diagnosis of drinking water networks by using first-in-area and water meter readers for drinking water networks and industrial consumers. With the realization of the project, the network diagnostics experts of the drinking water supply companies can make decisions about the areas of fault detection based on measurement results. The districts are characterized by minimum and maximum water consumption values in addition to the 24-hour daily cycles. Knowing the daily (night) mass flow minimum, you can quickly detect increased water flows, which can lead to pipe breaks and other abnormalities. The problem can be detected and corrected immediately afterwards. Area meters can be used to observe (as a result of monitoring for a longer period of time) changes in the amount of water that occurs as a result of consumer rhythms. With this in mind, improvements can be better targeted. Public consumers receive special attention from water utilities. Enabling them in the remote monitoring system allows remote reading of consumption at monthly (or any time) times. There is a possibility of a remote monitoring service, where the service provider informs the consumer on a continuous basis, recorded and evaluated on am hourly basis, about his consumption, possible overconsumption and other irregularities. With this in mind, you can develop environmentally conscious consumer behavior, resulting in more economical water consumption.
Results to be generated: • Transmission of the minimum consumption value in 24-hour daily cycles. • Transmission of maximum water consumption values in 24 hour daily cycles. • Alarm signal when the meter receives non-standard or set values (increase of mass flow minimum value, increase of daily maximum consumption) • Alarm signal when value indicating a pipe break is detected. • alarm signal if the meter does not transmit signals. • Consumption of any metering area or consumer (or their aggregation) between any time interval. • Minimum changes in mass flow between any metering area or consumer (or their aggregation) over any time interval. • Analyze the analysis of mass flow and consumption over a longer period. Conclusions. All values can be displayed both graphically and numerically!
1. Annex: water utility companies in Hungary
1 |
ALFÖLDVÍZ Regionális Víziközmű-szolgáltató Zrt. |
|
2 |
Aqua Szolgáltató Kft. |
|
3 |
BÁCSVÍZ Víz- és Csatornaszolgáltató Zrt. |
|
4 |
BAJAVÍZ Baja és Térsége Víz- és Csatornamű Kft. |
|
5 |
BAKONYKARSZT Víz- és Csatornamű Zrt. |
|
6 |
BARANYA-VÍZ Zrt. |
|
7 |
BORSODVÍZ Önkormányzati Közüzemi Szolgáltató Zrt. |
|
8 |
DAKÖV Dabas és Környéke Kft. |
|
9 |
Debreceni Vízmű Zrt. |
|
10 |
Dél-Pest Megyei Víziközmű Szolgáltató Zrt. |
|
11 |
Délzalai Víz- és Csatornamű Zrt. |
|
12 |
DMRV Duna Menti Regionális Vízmű Zrt. |
|
13 |
Dunántúli Regionális Vízmű Zrt. |
|
14 |
Dunaújvárosi Víz, - Csatorna – Hőszolgáltató Kft. |
|
15 |
E.R.Ö.V. Egyesült Regionális Önkormányzati Zártkörűen Működő Részvénytársaság |
|
16 |
Érd és Térsége Regionális Vízi Kft. |
|
17 |
ÉRV Északmagyarországi Regionális Vízművek Zrt. |
|
18 |
Északdunántúli Vízmű Zrt. |
|
19 |
Észak-zalai Víz- és Csatornamű Zrt. |
|
20 |
FEJÉRVÍZ Fejér Megyei Önkormányzatok Víz- és Csatornamű Zrt. |
|
21 |
Fővárosi Csatornázási Művek Zrt. |
|
22 |
Fővárosi Vízművek Zrt. |
|
23 |
Gyulai Közüzemi Kft. |
|
24 |
Heves Megyei Vízmű Zártkörűen Működő Részvénytársaság |
|
25 |
KAVÍZ Kaposvári Víz- és Csatornamű Kft. |
|
26 |
Kiskunsági Víziközmű-Szolgáltató Kft. |
|
27 |
Mezőföldvíz Regionális Víziközmű Kft. |
|
28 |
MIVÍZ Miskolci Vízmű Kft. |
|
29 |
Nyírségvíz Zrt. |
|
30 |
"PANNON-VÍZ" Víz- Csatornamű és Fürdő Zrt. |
|
31 |
Pápai Víz- és Csatornamű Zrt. |
|
32 |
Soproni Vízmű Zrt. |
|
33 |
Szegedi Vízmű Zrt. |
|
34 |
TETTYE FORRÁSHÁZ Zrt. |
|
35 |
Tiszamenti Regionális Vízművek Zrt. |
|
36 |
VASIVÍZ Vas Megyei Víz- és Csatornamű Zrt. |
|
37 |
Víz- és Csatornaművek Koncessziós Zrt. Szolnok |
|
38 |
Zempléni Vízmű Kft. |
|
39 |
Érd és Térsége Csatorna-szolgáltató Kft. |
|
40 |
Hajdúkerületi és Bihari Víziközmű Szolgáltató Zrt. |
|
41 |
TÖRSVÍZ Csatornamű Üzemeltető és Szolgáltató Kft. |