
")
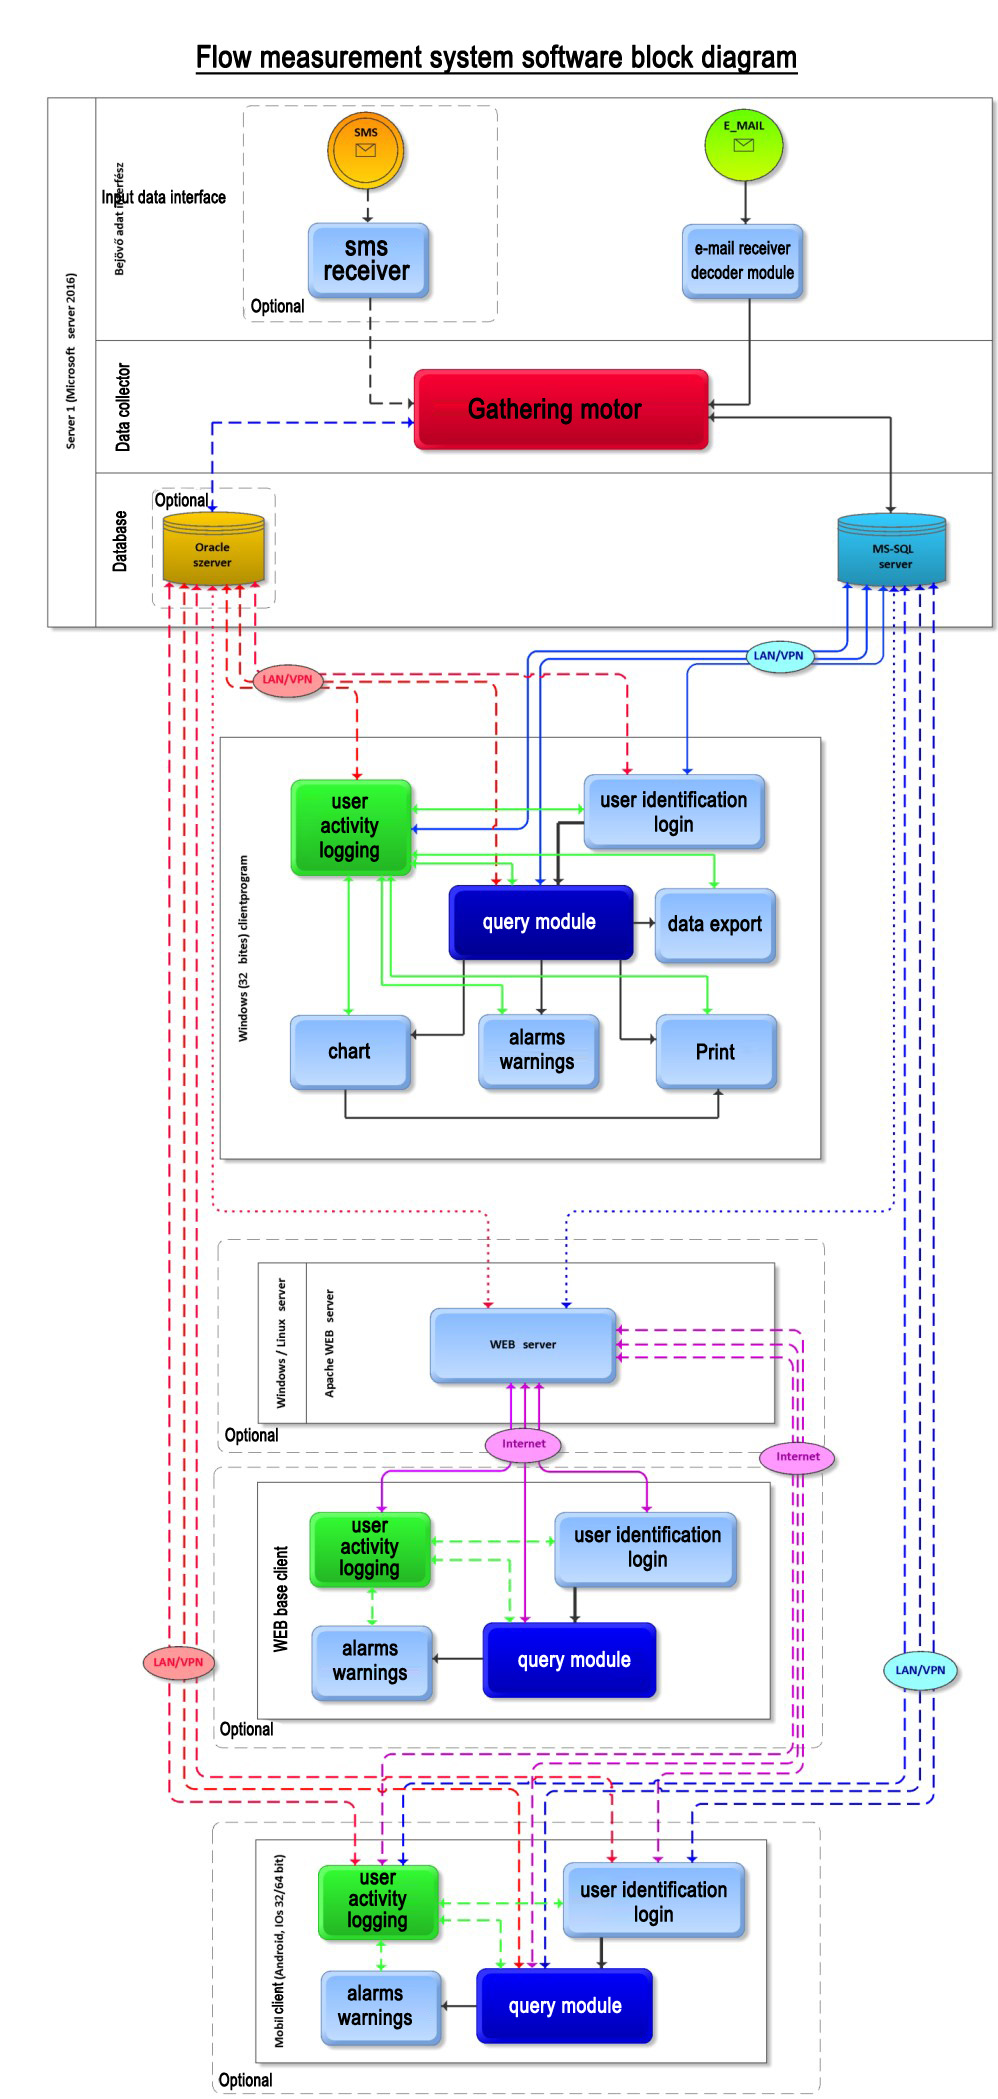
The data is fed to the processing server according to the block diagram below, where the data is evaluated and graphically and textually displayed.This can be displayed on the clients connected to the server.
The results of the evaluated data can be displayed both graphically and textually on a client computer as follows:
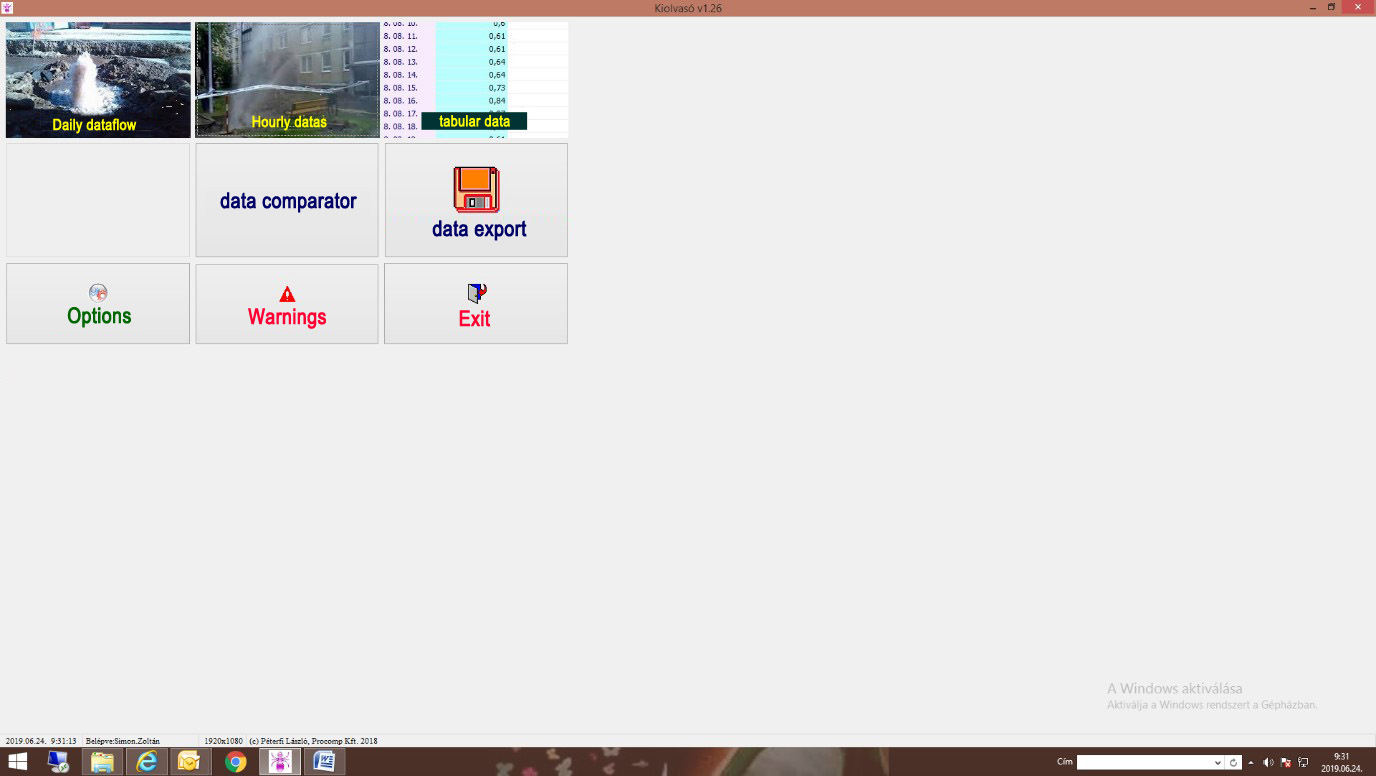

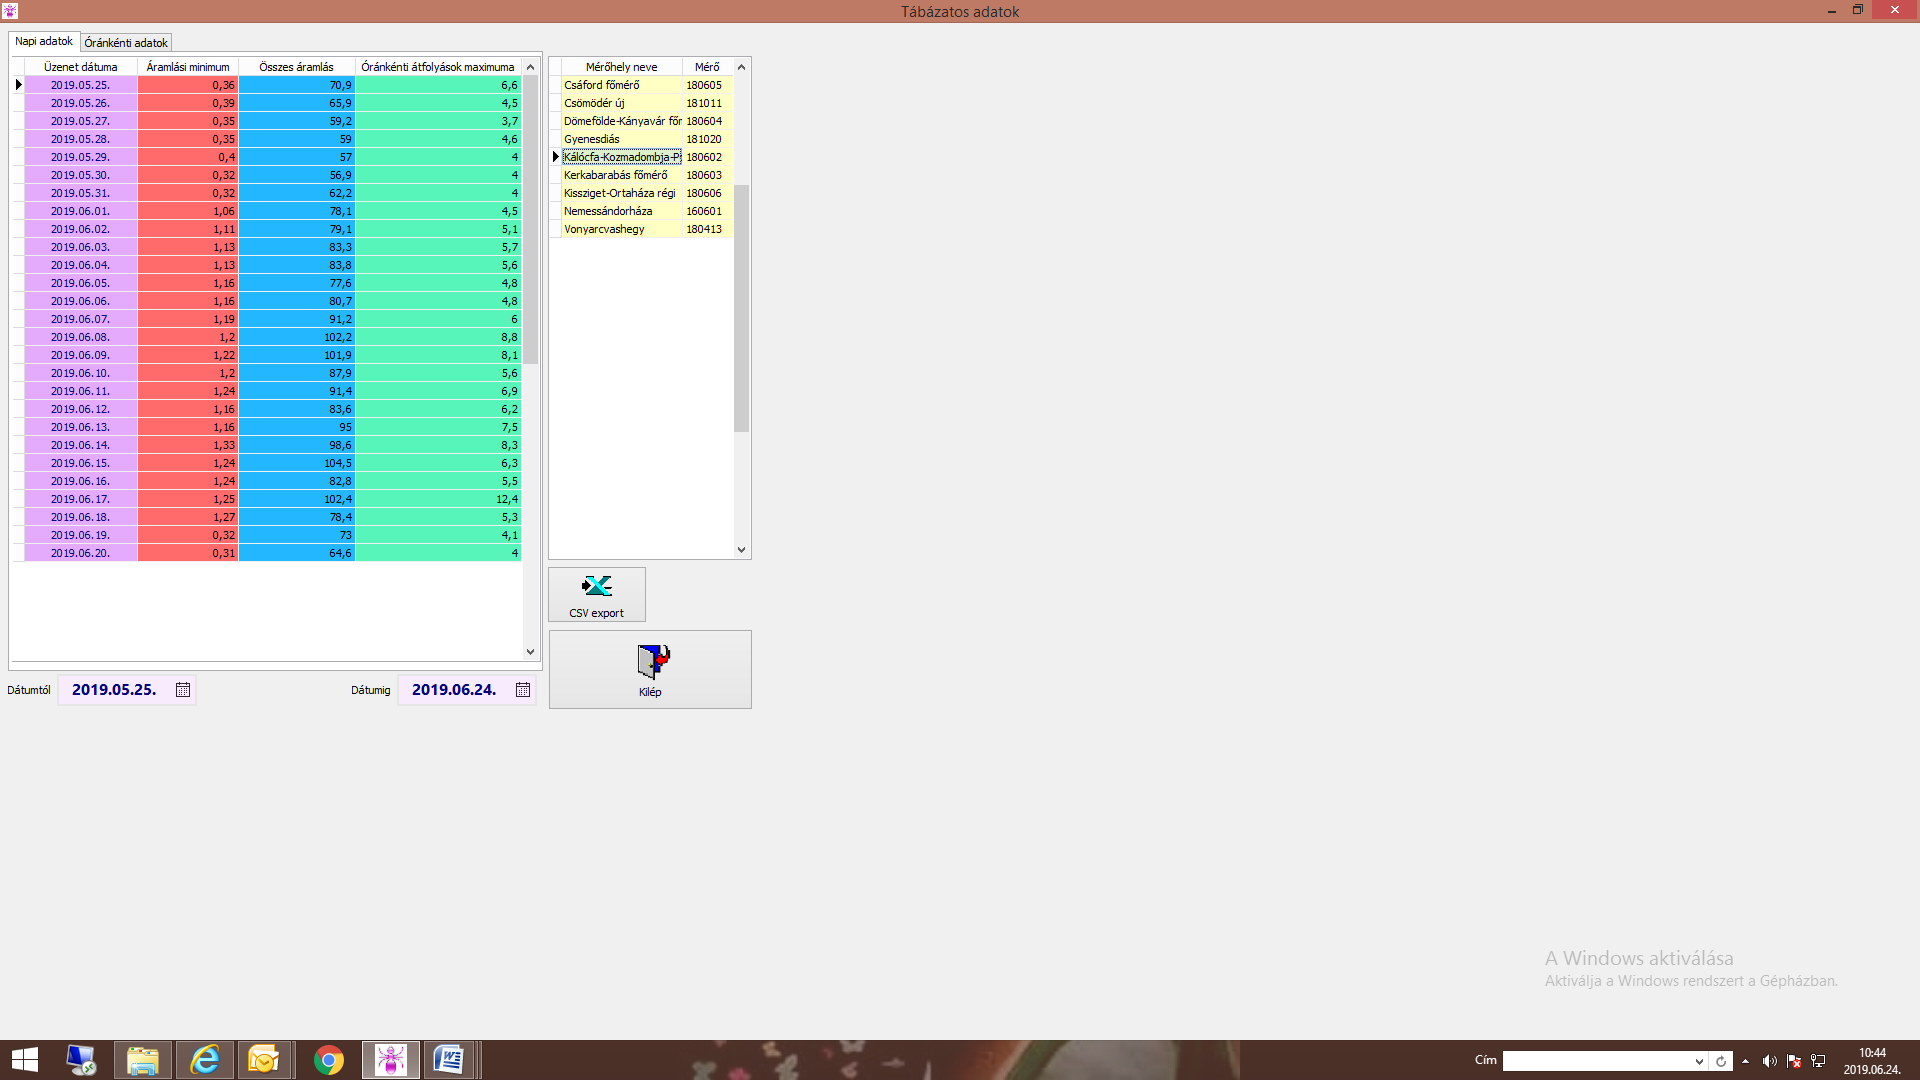
The interface shows the following viewer. Daily flow data for the selected area for the specified time period are aggregated daily
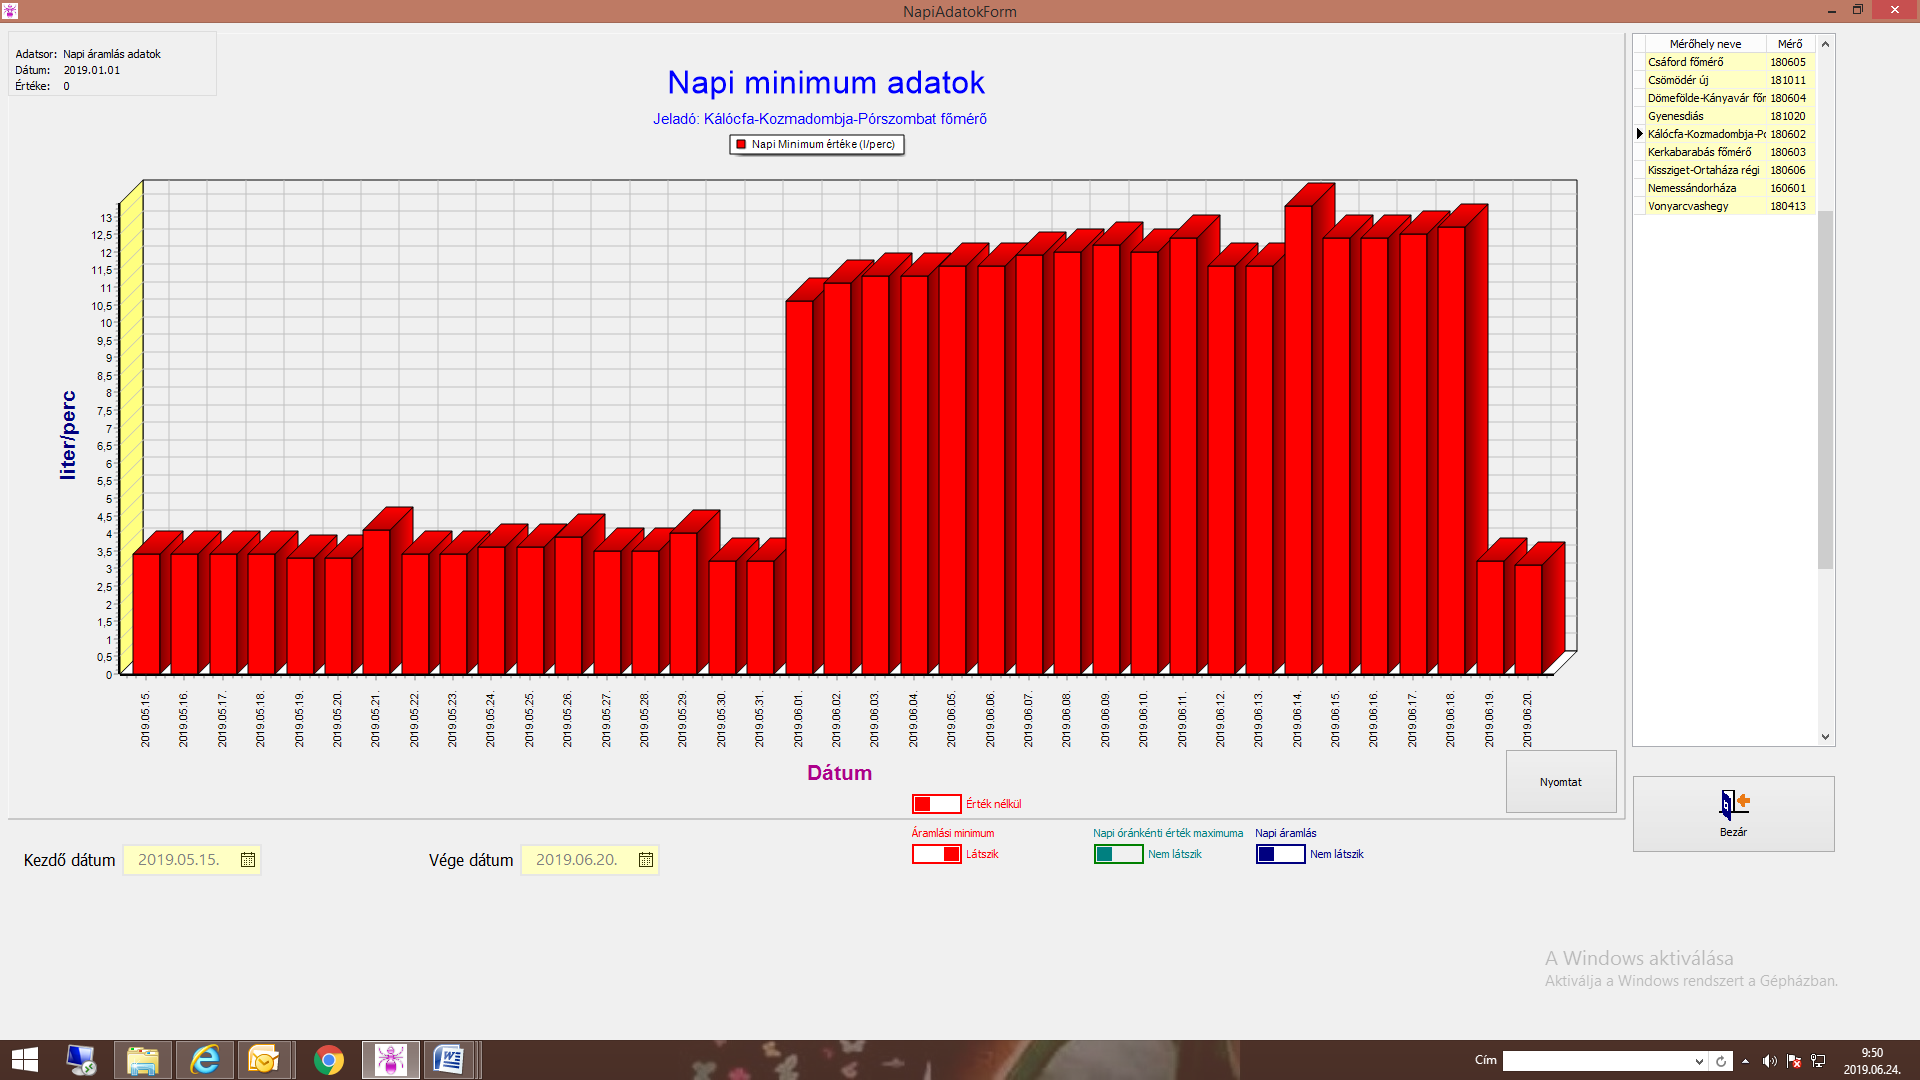

maximum value in l / min

flow rate in m3
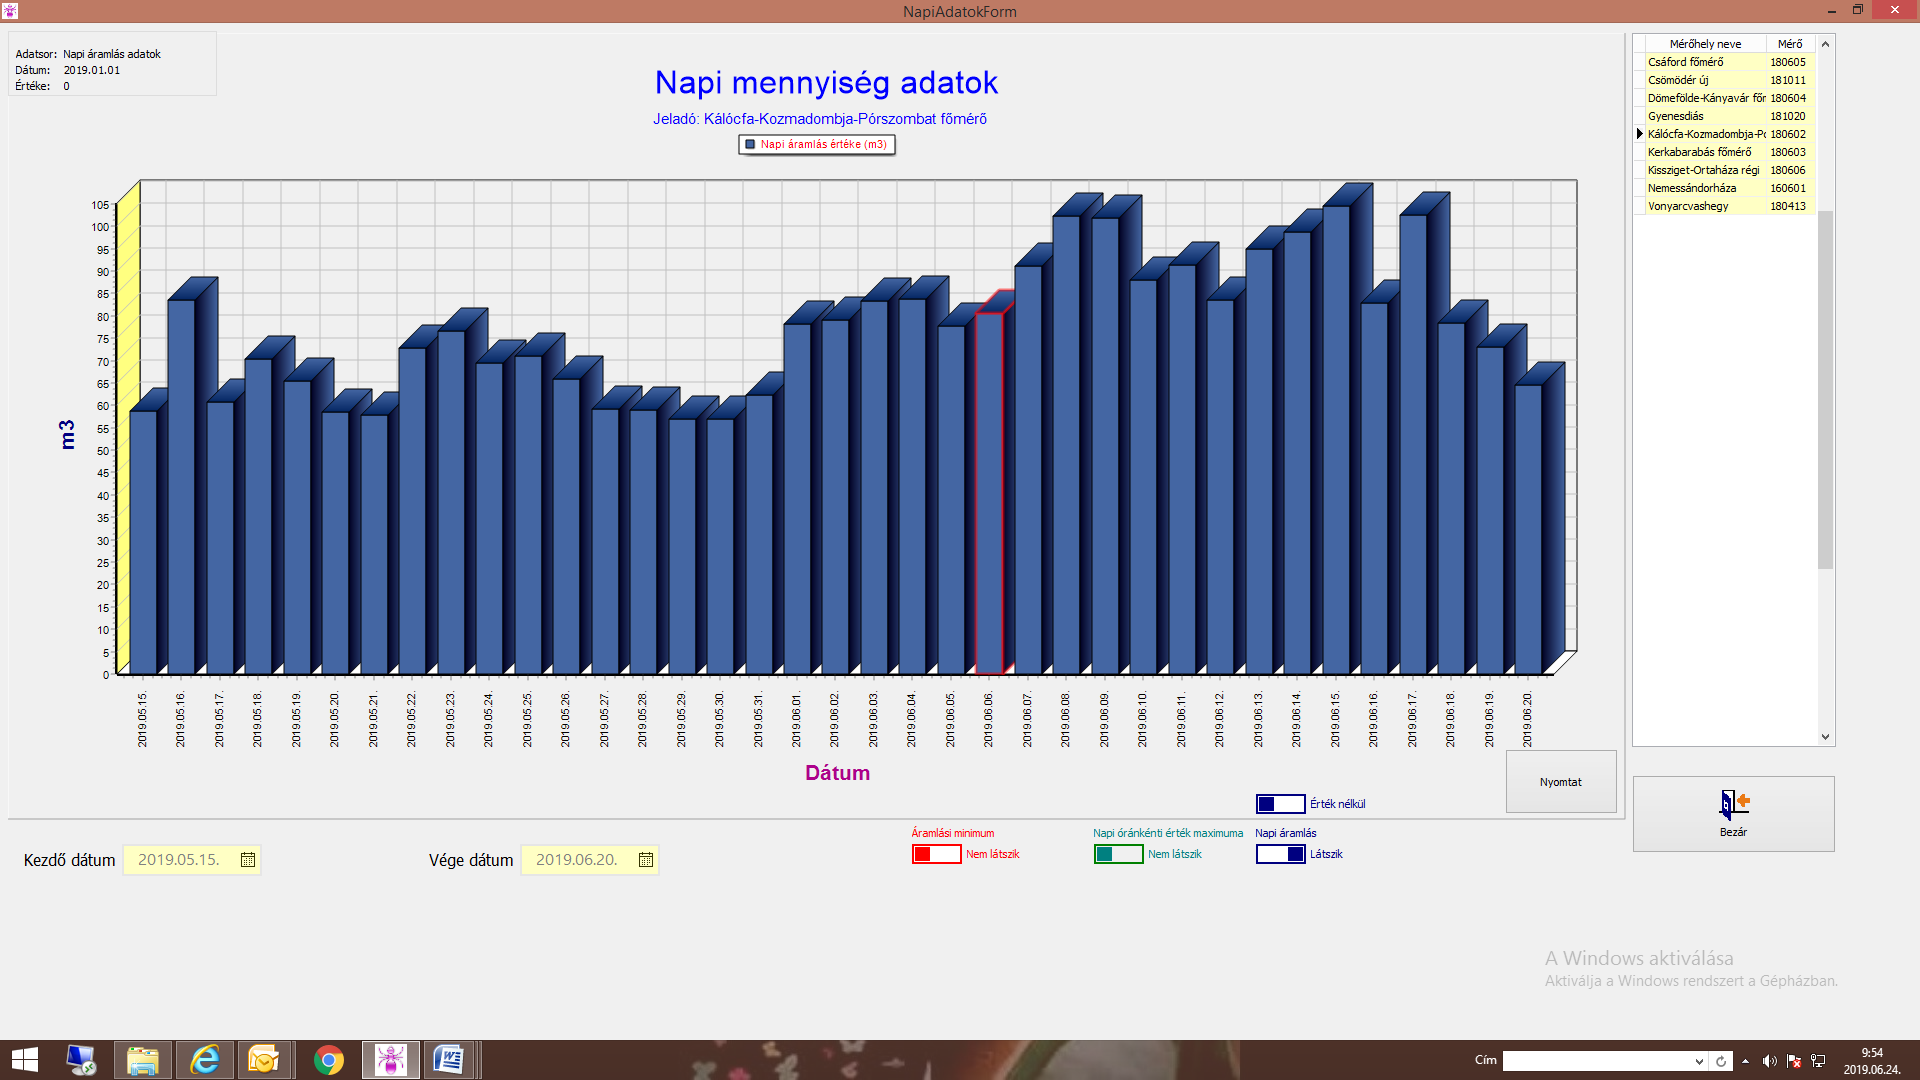
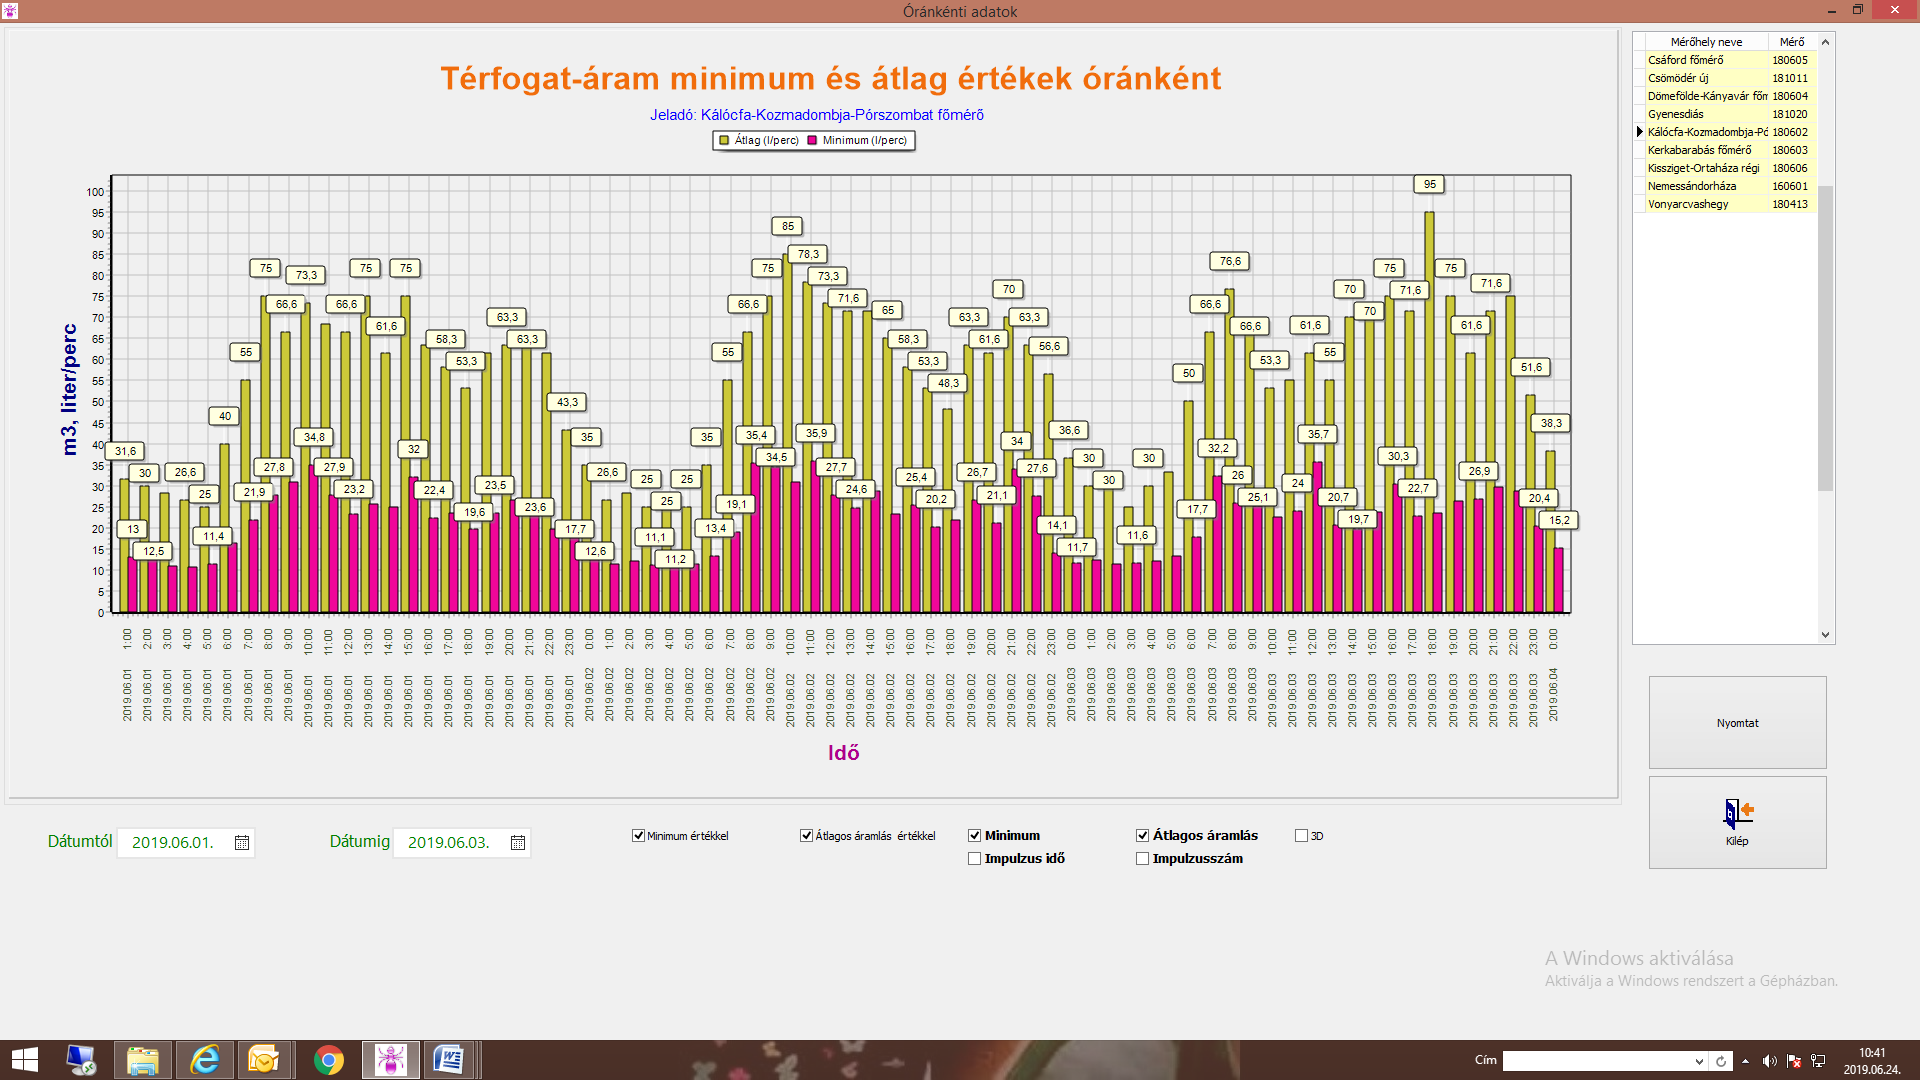
The display can also be configured to display daily values numerically on the graph, and even display all three graphs in a single graph.
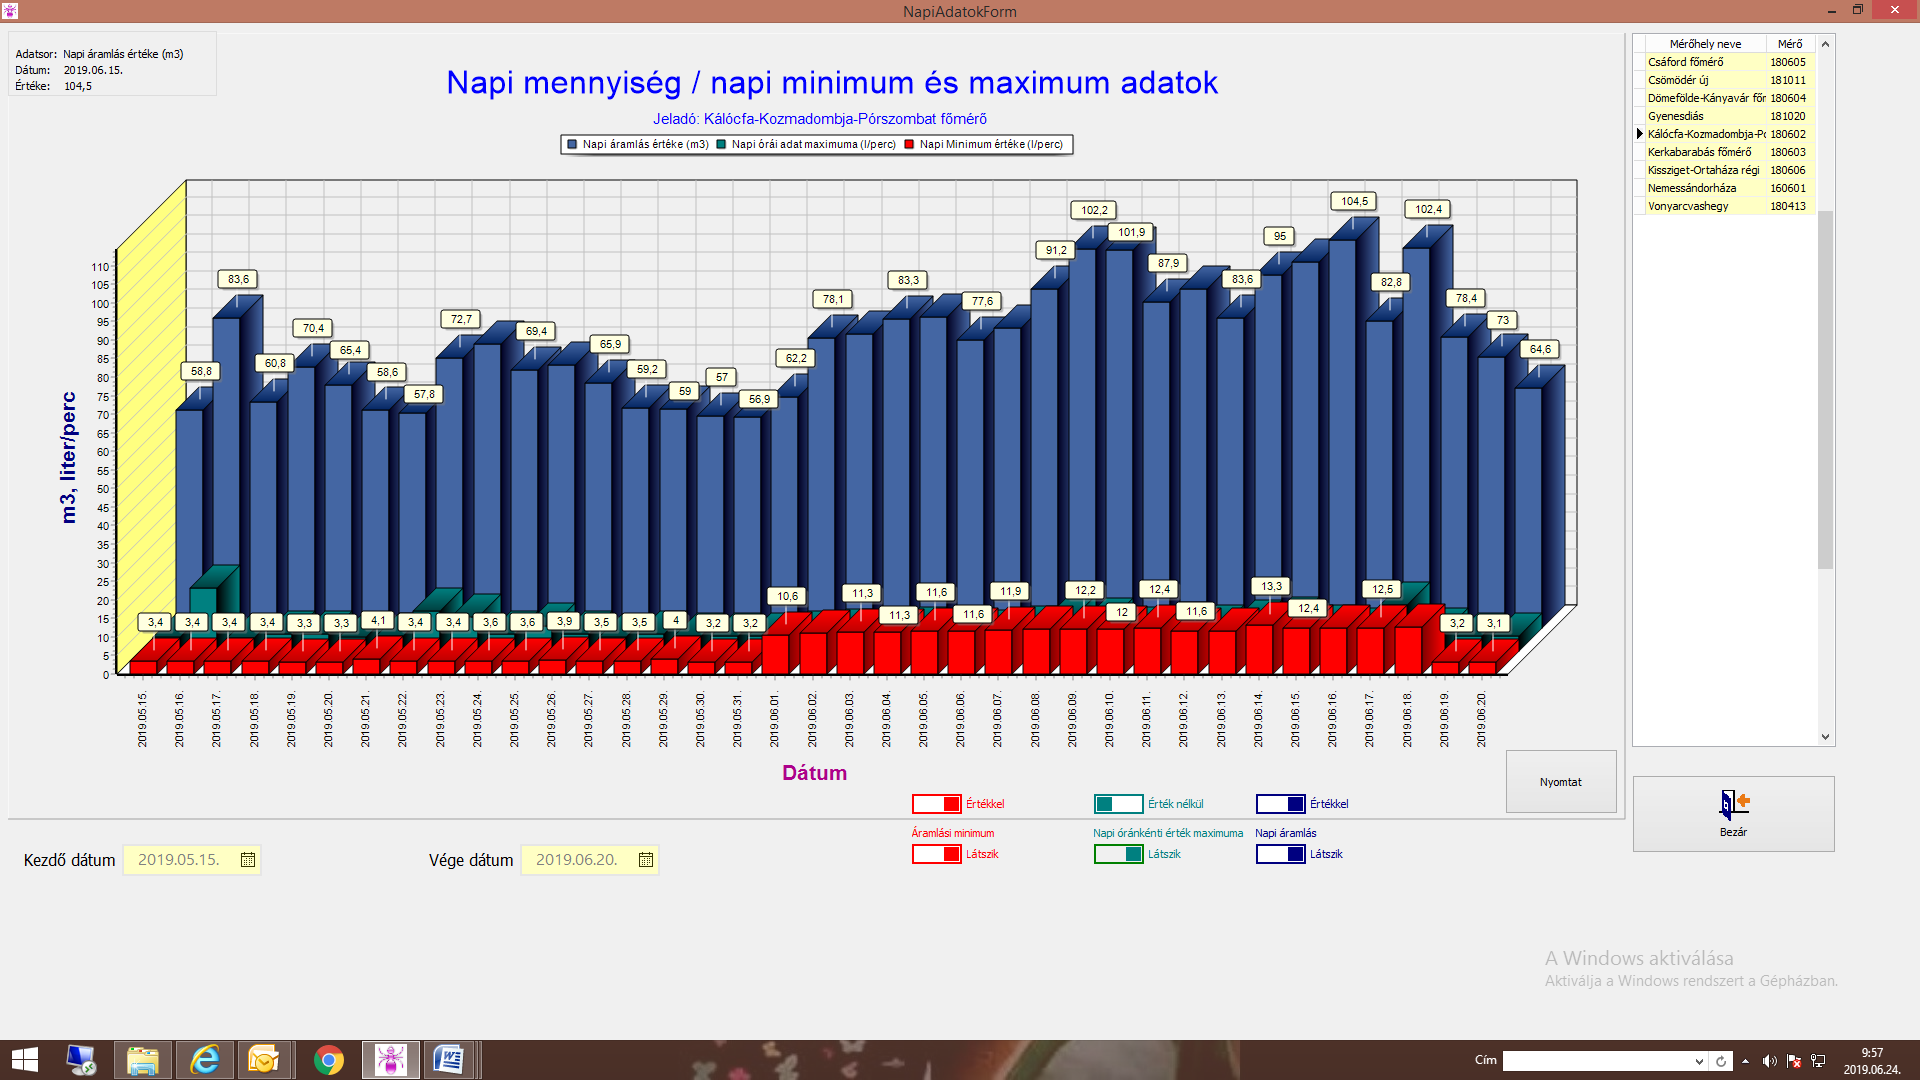

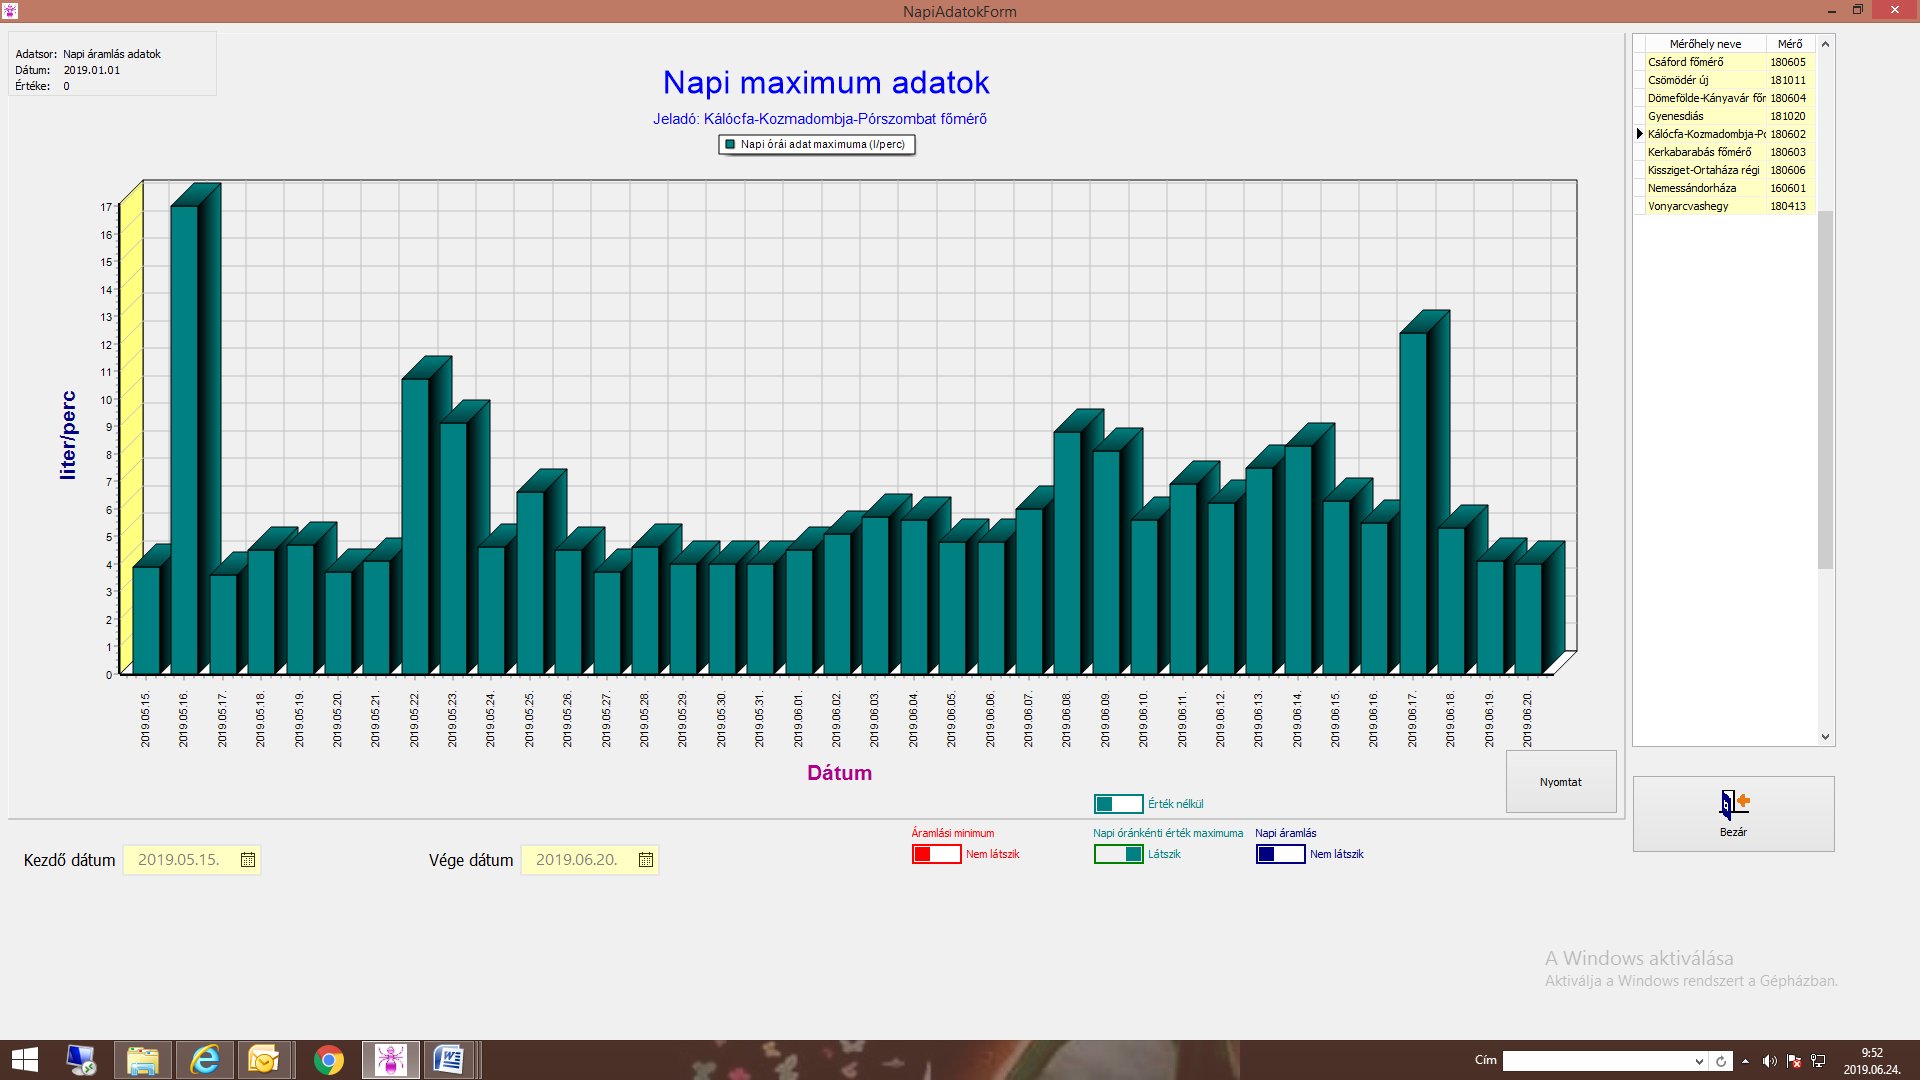
Hourly Flow Data Flow Data provides hourly data for the selected region for a specified time period as follows:
volumetric flow minimum values in m3 l / min
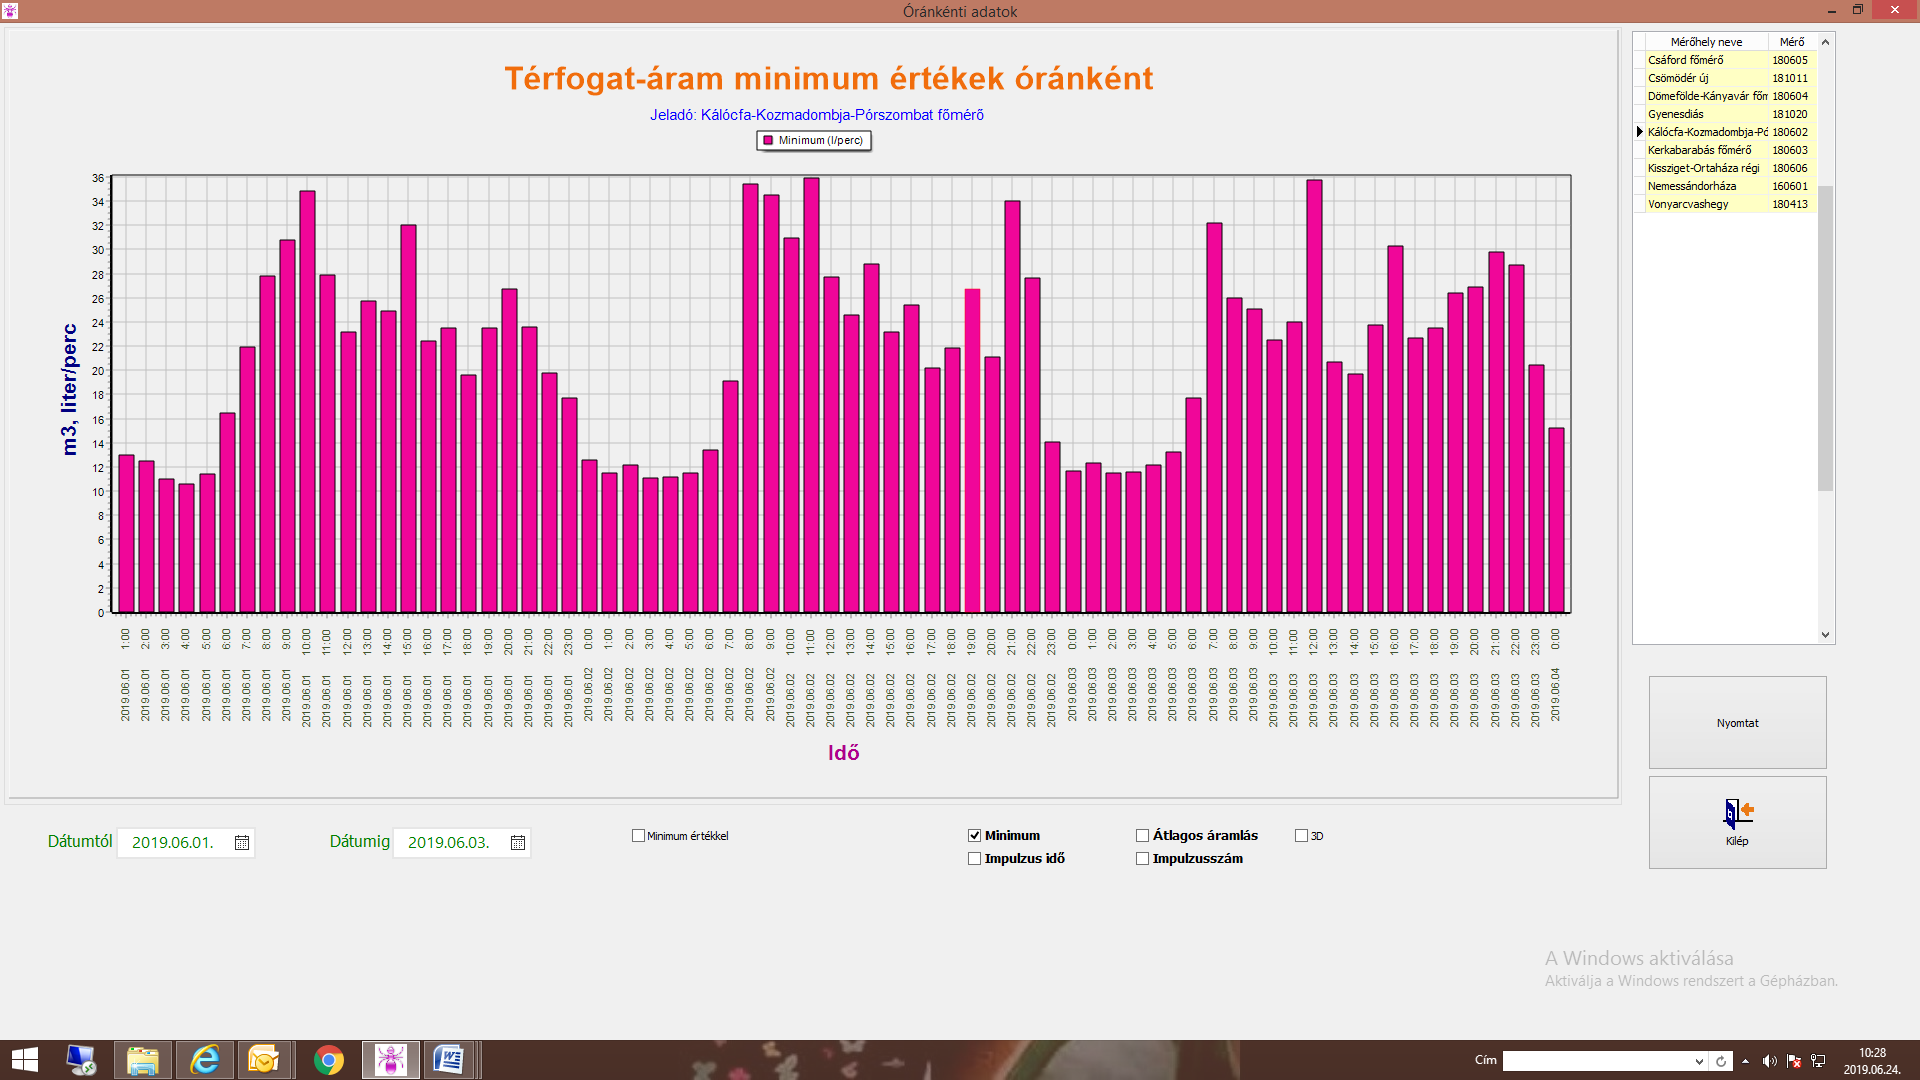

volume flow rates minimum values in hours per second
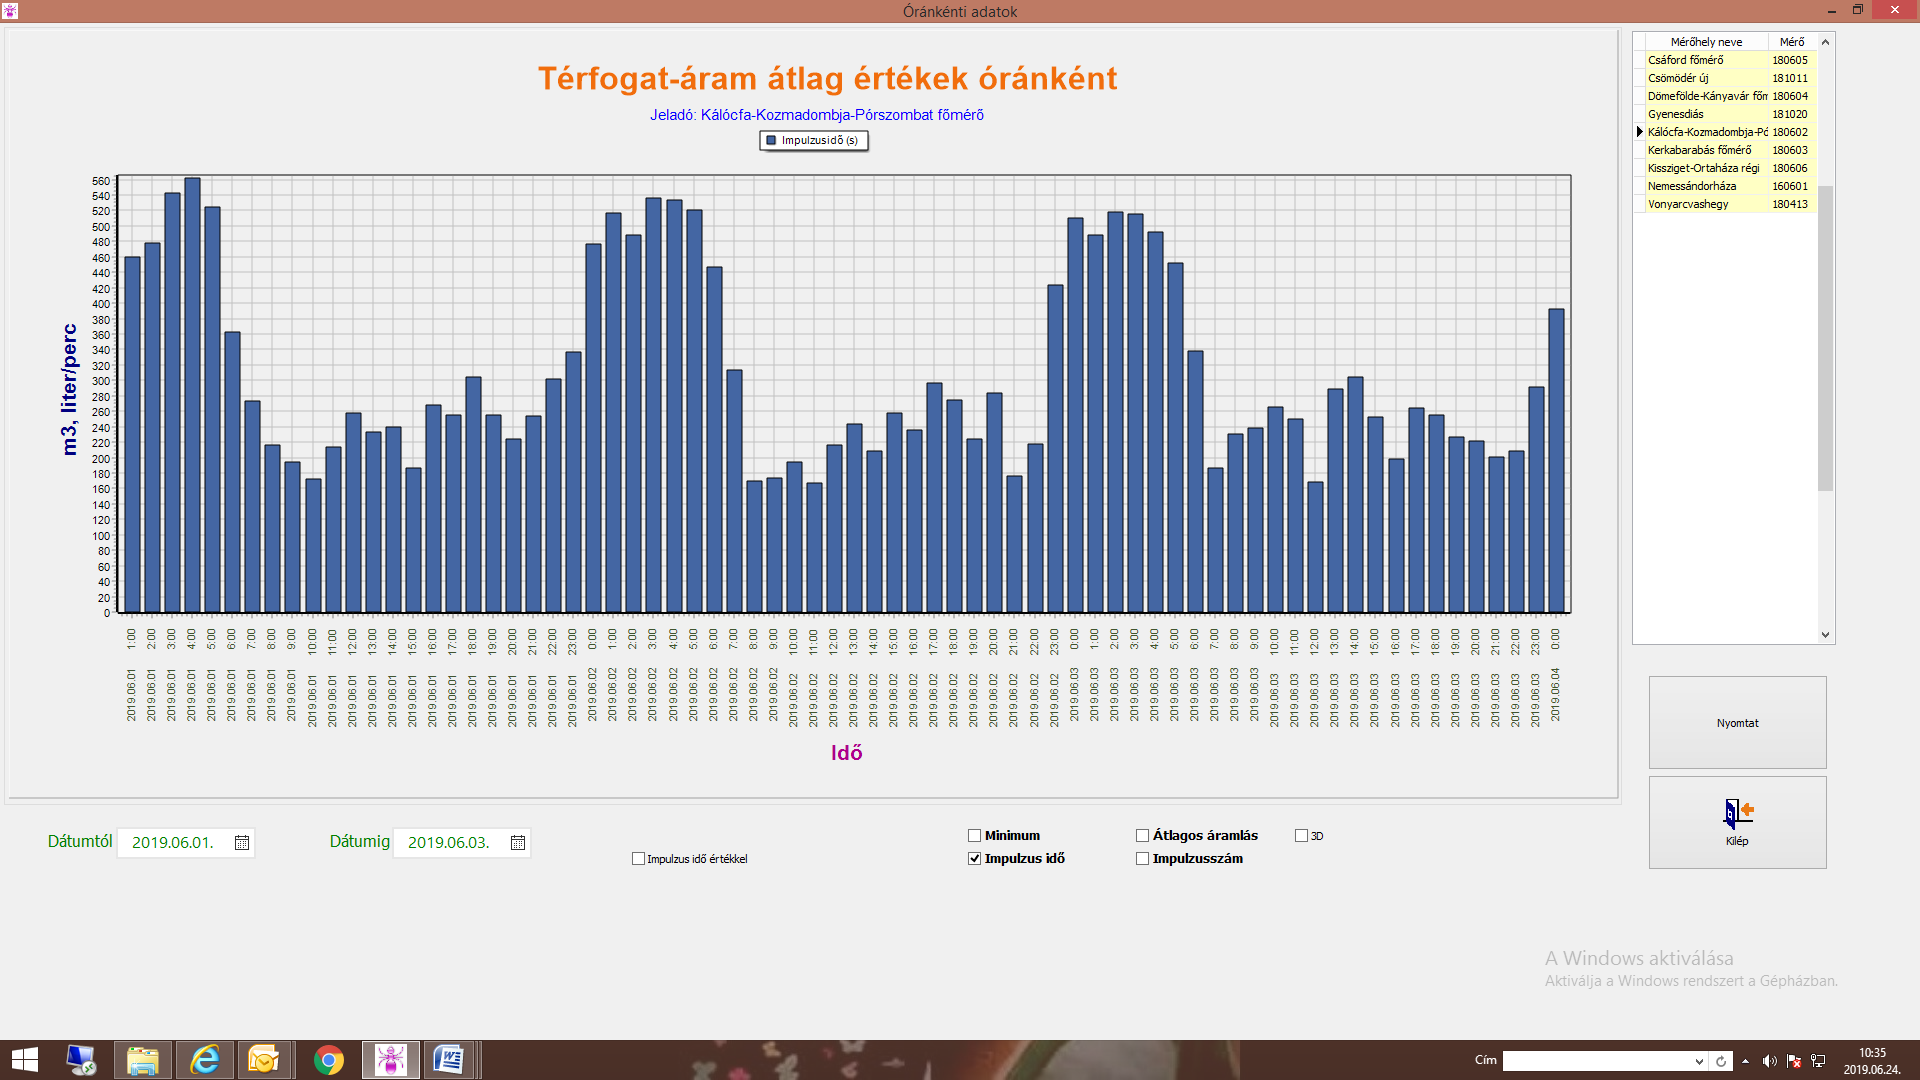

volume flow rates are averaged per m3 in l / min
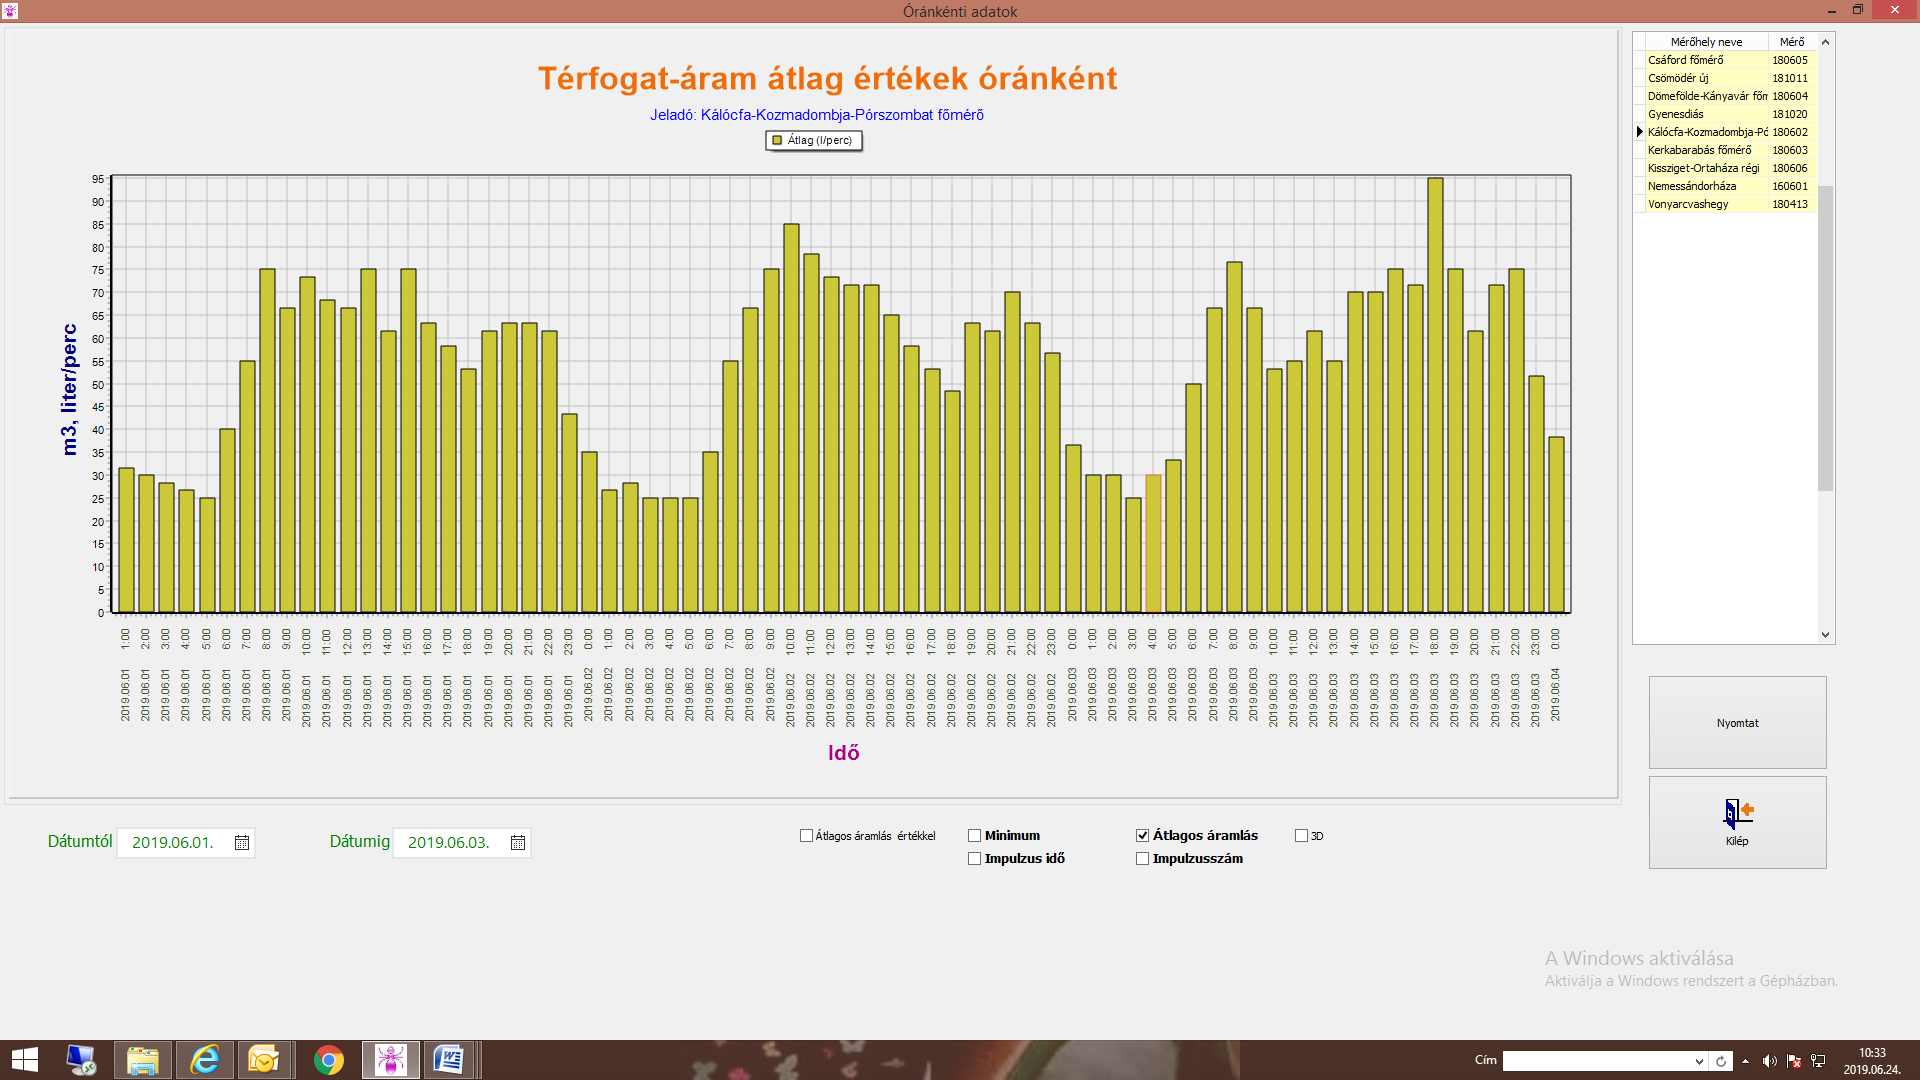

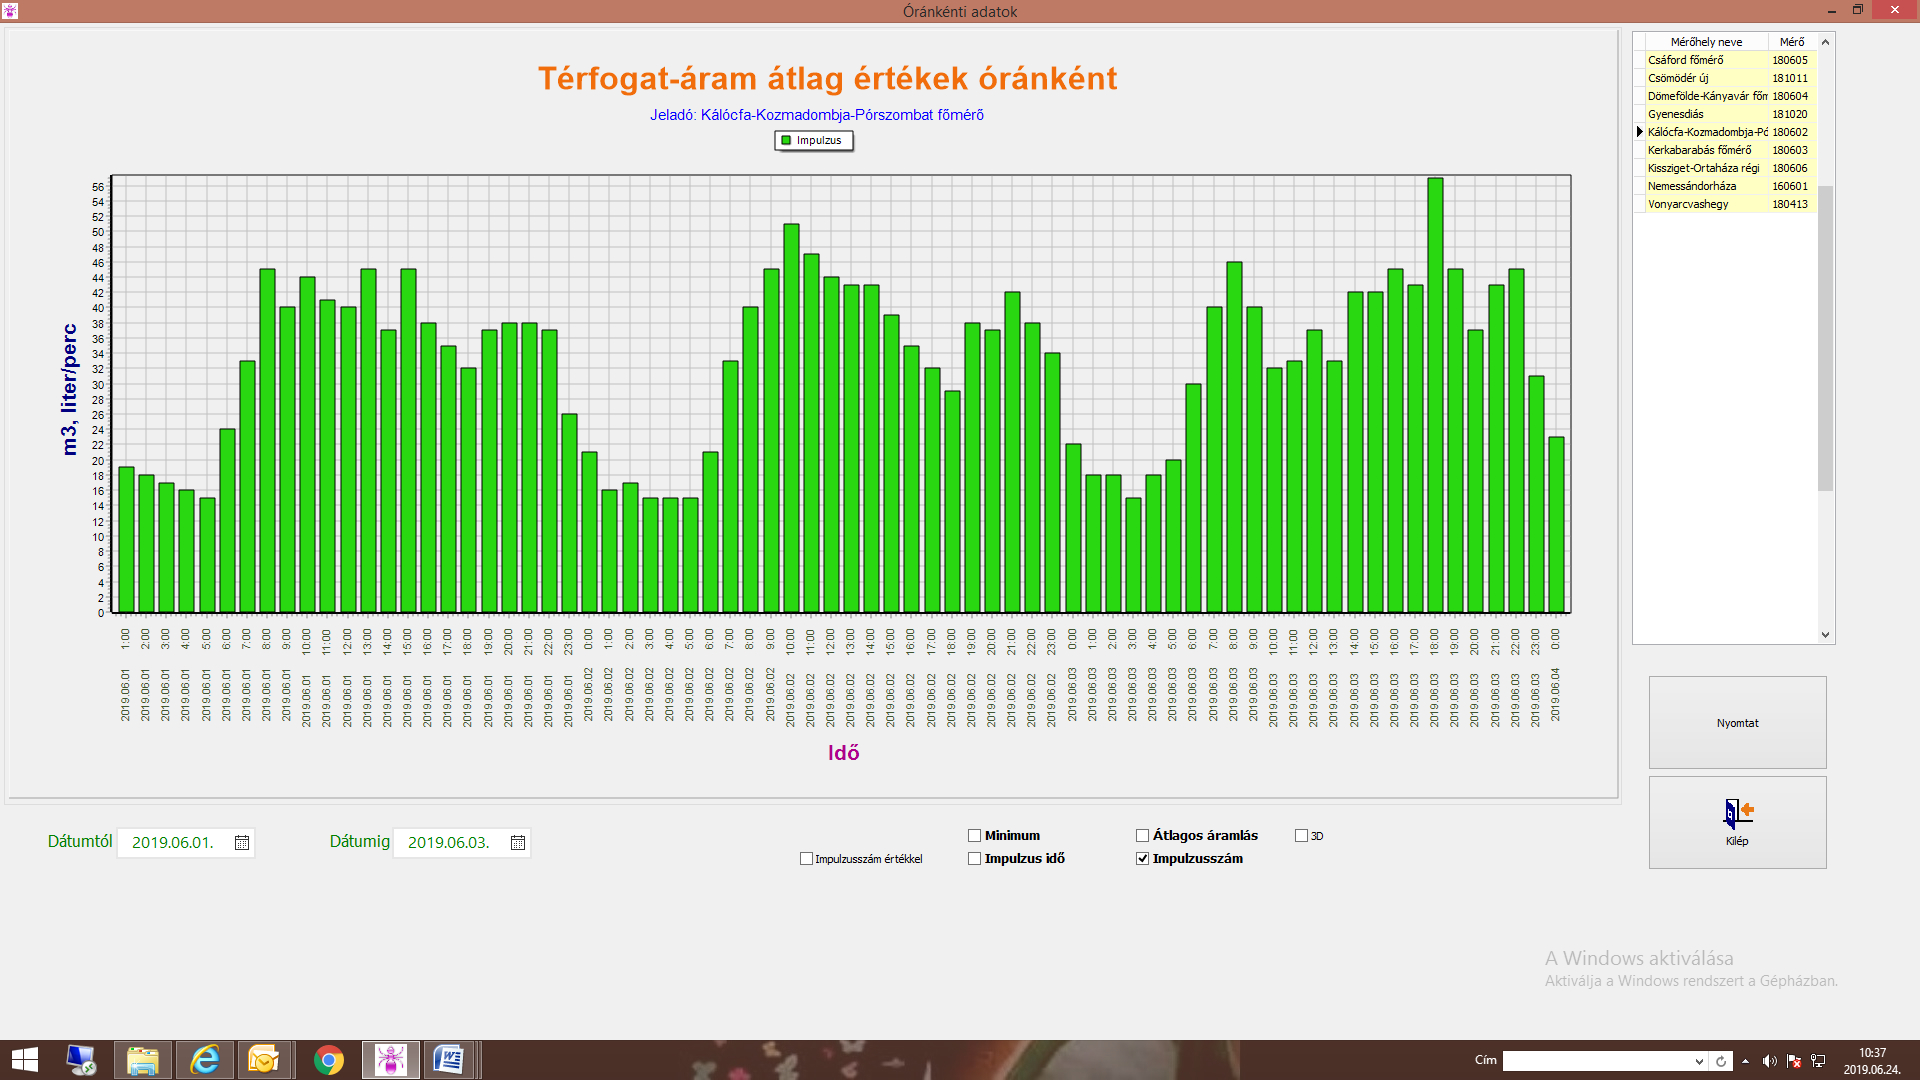
Volume flow average values per hour (pulse) in l / min

The display can also be configured to display daily values numerically on the graph, and even display all three graphs in a single graph.
The results of the evaluated data can be displayed both graphically and textually on a client computer as follows:

The interface shows the following viewer.
Datachart:
Depending on the selection, it displays daily or hourly data in tabular form

Alarms:
Immediate alarm if a value indicating a pipe break is detected.
There is a possibility of a remote monitoring service, where the service provider informs the consumer on a continuous basis, recorded and evaluated on an hourly basis, about his consumption, possible overconsumption and other irregularities. With this in mind, you can develop environmentally conscious consumer behavior, resulting in more economical (economical) water consumption. Results to be generated: • Transmission of the minimum consumption value in 24-hour daily cycles. • Transmission of maximum water consumption values in 24 hour daily cycles. • Alarm signal when the meter receives non-standard or set values (increase of mass flow minimum value, increase of daily maximum consumption) • Alarm signal when value indicating a pipe break is detected. • alarm signal if the meter does not transmit signals. • Consumption of any metering area or consumer (or their aggregation) over any time interval. • Minimum changes in mass flow between any metering area or consumer (or their aggregation) over any time interval. • Analyze the analysis of mass flow and consumption over a longer period. Conclusions. All values can be displayed both graphically and numerically! D) With this in mind, you can develop environmentally conscious consumer behavior, resulting in more economical (economical) water consumption. Emerging (to be created) results: • Transmission of the minimum consumption value in 24 hour daily cycles. • Maximum water consumption values in 24 hour daily cycles transmission. • an alert if there are values other than the normal or set values (mass flow minimum value) increase, increase in maximum daily consumption) • alarm if a value indicating a pipe break is detected. • alarm signal if the meter is not transmits signals. • Consumption of any metering area or consumer (or their aggregation) over any time interval. • Minimum variations in mass flow between any metering area or consumer (or their aggregation) over any time interval. • Longer period analysis of mass flow and consumption. Conclusions. All values can be displayed both graphically and numerically!